
Are Your Probabilities Honest? A Practical Guide to Calibration and the Brier Score
Saying 70% is a promise: about seven in ten such calls should come true. How to check that promise with a table, a chart and one number, using twenty forecasts.
Synthetic dataExamples on this page use synthetic data created for illustration.
Not adviceThis is educational material. It is not investment, business or other professional advice.
On this page
When someone says “I am 90% sure”, they are making a statement that can be checked. Over many such statements, about nine in ten should turn out true. If only six in ten do, the speaker is overconfident, whatever the quality of their reasoning on any single case. The same holds for a model that outputs probabilities, such as “73% chance this item rises”. This article shows how to test the promise, with a worked example small enough to follow by hand.
Two things a forecast can get right
A probability forecast can be good in two different ways, and people confuse them.
- Calibration: the stated probabilities match how often things happen. Of all the “70%” calls, about 70% come true.
- Sharpness (or resolution): the forecasts say something. A forecaster who answers “55%” to everything may be perfectly calibrated and tells you nothing you did not know.
A useful forecaster is both: calibrated and sharp. Calibration is the part that is easiest to lose through overconfidence, so we start there (Calibration).
A worked example: twenty forecasts
Over a month, an analyst made twenty calls of the form “this item’s rating count will rise more than 10% this week”, each with a stated probability. Afterwards we know which came true.
| Stated probability | Number of calls | Came true | Observed frequency |
|---|---|---|---|
| 90% | 5 | 4 | 80% |
| 70% | 6 | 4 | 67% |
| 50% | 5 | 2 | 40% |
| 30% | 4 | 1 | 25% |
Grouping calls by their stated probability and comparing with what happened is the whole method. Here the observed frequencies are all a little below the stated ones: a mild case of overconfidence. With only twenty calls the differences could be chance, so treat the table as a hint, not a verdict; with a few hundred calls the picture becomes reliable.
The reliability diagram
Plot stated probability on one axis and observed frequency on the other. Perfect calibration is the diagonal. Points below it mean overconfidence; points above it, underconfidence. The chart below uses a larger set of 100 calls (20 at 90%, 40 at 70%, 40 at 50%) to show a typical pattern: the middle is fine, the top is too confident.
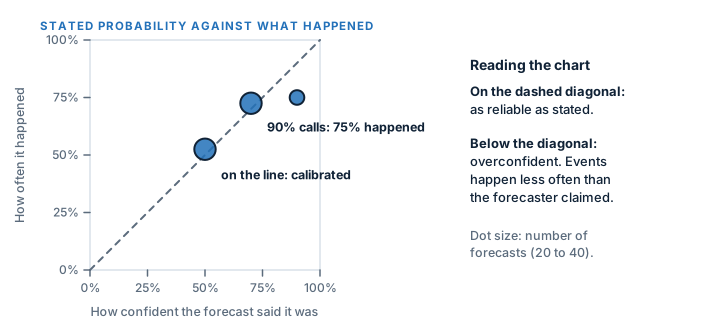
The usual finding, for people and for many machine-learning models alike, is that the highest probabilities are the least trustworthy: a forecaster who says 90% often deserves 75% (Outcome Bias hides this, because each individual success feels like confirmation).
One number: the Brier score
To summarise, use the Brier score (Brier Score): the average squared gap between the stated probability and the outcome, where the outcome is 1 if it happened and 0 if not. Lower is better; 0 is perfect.
For the twenty calls above, the squared errors add up like this:
| Group of calls | Squared errors |
|---|---|
| 90%, 4 came true | 4 × (0.9 − 1)² = 0.04 |
| 90%, 1 did not | 1 × (0.9 − 0)² = 0.81 |
| 70%, 4 came true | 4 × (0.7 − 1)² = 0.36 |
| 70%, 2 did not | 2 × (0.7 − 0)² = 0.98 |
| 50%, any outcome (5 calls) | 5 × 0.25 = 1.25 |
| 30%, 1 came true | 1 × (0.3 − 1)² = 0.49 |
| 30%, 3 did not | 3 × (0.3 − 0)² = 0.27 |
| Total | 4.20 |
Brier score = 4.20 / 20 = 0.21.
Compare with a baseline
A score of 0.21 means nothing alone. Compare it with the simplest forecaster: one who ignores everything and always says the overall frequency. Here 11 of 20 calls came true, a base rate of 55%. Always saying 55% scores 0.55 × 0.45 = 0.2475. The skill score is one minus the ratio: 1 − 0.21 / 0.2475 = 0.15. The analyst’s calls are about 15% better than always saying the base rate, a modest edge (Base Rate, Baseline).
Why the Brier score is hard to cheat
Because the error is squared, a confident miss costs a lot: saying 95% for something that does not happen costs 0.90, saying 60% costs only 0.36. And because it is a proper scoring rule, the way to get the best long-run score is to state what you really believe; neither exaggerating nor hedging helps (Gneiting and Raftery explain why). It combines calibration and sharpness in one figure, which is why it is a standard for forecasts.
How to improve
- Keep score. Write down the probability before the outcome and look at the results regularly. Philip Tetlock’s forecasting tournaments found that feedback of this kind is what separates good forecasters from the rest.
- Start from the base rate, then adjust for the specifics. Extreme probabilities need strong evidence.
- Use ranges and several scenarios rather than one confident story.
- Recalibrate. If your 90% calls come true 75% of the time, treat your “90%” feeling as 75%. Models can be recalibrated mechanically after training; Guo and colleagues show that many modern neural networks need it.
- Beware of tiny samples. Twenty calls cannot distinguish 70% from 60%. Collect enough before drawing conclusions.
A habit to adopt
Put a probability in every Decision Record, and a review date. A month later, tick which came true. After a hundred records you will have a calibration table of your own, which is worth more than any general advice about overconfidence.
References
- Glenn W. Brier. Verification of Forecasts Expressed in Terms of Probability . Monthly Weather Review, 1950. DOI: 10.1175/1520-0493(1950)078<0001:VOFEIT>2.0.CO;2
- Tilmann Gneiting, Adrian E. Raftery. Strictly Proper Scoring Rules, Prediction, and Estimation . Journal of the American Statistical Association, 2007. DOI: 10.1198/016214506000001437
- Philip E. Tetlock, Dan Gardner. Superforecasting: The Art and Science of Prediction . Crown, 2015. ISBN 978-0804136693.
- Chuan Guo, Geoff Pleiss, Yu Sun, Kilian Q. Weinberger. On Calibration of Modern Neural Networks . Proceedings of the 34th International Conference on Machine Learning, 2017.