
Top-N Lists Are Not the Market: Sampling Frames, Rank and Sales
A list of the 100 best sellers describes the best sellers. It is a selected sample whose members were chosen by the very thing you may want to measure. What it can and cannot tell you.
Synthetic dataExamples on this page use synthetic data created for illustration.
On this page
Most online marketplaces publish a ranking: the best-selling products in a category, usually the top 50 or 100. It is free, updated often and easy to collect, so it is the first data source many market studies reach for. But a Top-N list is a very particular kind of dataset. Understanding what it is, and what it is not, prevents the most common mistakes in market research built on rankings.
What a Top-N list is
A Top-N list is a sample of the products in a category. Its members were chosen by being ahead on one measure, recent sales, as judged by the platform’s own formula. That makes it a sampling frame with a built-in selection effect (Sampling Frame, Selection Bias): the list contains exactly those products that did best on the thing you may want to study.
Two consequences follow at once.
- It cannot represent the whole category. Whatever is typical of the 100 best sellers need not be typical of the 20,000 products that are not on the list.
- Anything you compute about sales from it is biased upward, because sales were the selection criterion.
How much of the market is in the list?
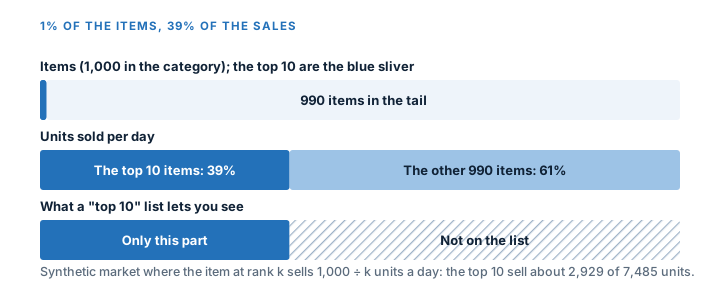
Sales in most categories are very uneven (Power-law Distribution, Long Tail): a few products sell a lot and most sell little. Take a synthetic category of 20,000 products in which the product at rank k sells 1,000 / k units a day.
| Part of the category | Products | Share of products | Units a day | Share of sales |
|---|---|---|---|---|
| The top 100 (the list) | 100 | 0.5% | about 5,187 | about 49% |
| Everything else | 19,900 | 99.5% | about 5,293 | about 51% |
| The median product (rank 10,000) | 1 | 0.1 |
The top 100 products carry about half of all sales, yet make up one half of one percent of the products. The 19,900 others sell as much in total, but each sells almost nothing: the median product sells a tenth of a unit a day. A study of the list sees half the sales and an insignificant slice of the products.
Rank is not sales
A rank tells you who is ahead, not by how much (Sales Rank). Three cautions:
- The curve is steep at the top and flat at the bottom. Moving from rank 5 to rank 10 may halve sales; moving from rank 5,000 to 5,005 changes almost nothing.
- The same rank means different sales in different categories. Rank 500 in a huge category and rank 500 in a small one are different businesses.
- Ranks move. A product at rank 40 yesterday and rank 400 today may have sold the same amount; the ranks around it moved.
Studies of one large online bookseller found that sales follow a roughly power-law relation to rank, which allows a rough conversion for one category if you fit the curve there. The conversion is an estimate, with error, and valid for that platform and category at that time.
The list as a moving window
A snapshot of the list on one day is a sample; the same list over many days is a window through which products pass. Watching it reveals who enters, who stays and who leaves. Treat that as a Panel Data problem: if you only study the products on the list today, you miss everything that was on it last month and left (a form of Survivorship Bias). Keep the exits, with the date they left, and note whether the list was captured completely each day (Data Snapshot).
What you can say
| Careful statement | Why it is supportable |
|---|---|
| “The products on the top-100 list had a median price of 24.” | It describes the list |
| “Among the best sellers, short titles are common.” | It describes the best sellers, and says nothing about causes |
| “Entries to the list were 30% cheaper than the products already there.” | A comparison within the list over time |
And what you cannot:
| Overreach | Problem |
|---|---|
| “Products in this category cost 24 on average.” | The list is not the category |
| “Short titles increase sales.” | Only the winners were examined; the non-winners with short titles are missing |
| “The market grew 20%.” | The sum of the list’s sales is not the market, and the list’s members change |
What to do about it
- State the frame in the first sentence of any result: “among the 100 best sellers in category X on date D”.
- Say that coverage is unknown rather than implying it is complete (“the list covers an unknown share of the category”).
- Widen the frame where you can: more categories, deeper ranks, a random sample of the category if the platform allows one. Compare the list with the sample to see how different they are.
- Follow entries and exits over time instead of studying one day.
- Do not sum ranks or average them arithmetically, and do not call a rank a sales figure.
- Look for independent anchors: published totals, known sales of a few products, seller-provided data, so that your rank-based estimates can be checked.
The one-sentence rule
A Top-N list describes the top N. Everything else about the market is an extrapolation, to be labelled as such, and checked against something that is not a Top-N list.
References
- Erik Brynjolfsson, Yu Jeffrey Hu, Michael D. Smith. Consumer Surplus in the Digital Economy: Estimating the Value of Increased Product Variety at Online Booksellers . Management Science, 2003. DOI: 10.1287/mnsc.49.11.1580.20580
- Robert M. Groves et al.. Survey Methodology . Wiley, 2009. ISBN 978-0470465462.
- Anita Elberse. Should You Invest in the Long Tail? . Harvard Business Review, 2008.