
The Look-Ahead Trap: Why Your Backtest Looks Too Good
A test that quietly uses information from after the decision date will look better than anything that could have been achieved. Four ways the future leaks in, a simulation of one of them, and how to close them.
Synthetic dataExamples on this page use synthetic data created for illustration.
Not adviceThis is educational material. It is not investment, business or other professional advice.
On this page
A rule is tested on the past and looks brilliant. It is put to work and does nothing special. Before blaming bad luck, look for a leak: somewhere in the test, information from after the decision date got in. This is Look-ahead Bias, and it is the most common reason that historical results look better than anything that could have been achieved at the time.
What “the future got in” means
A decision made on day 20 may use only what was known on day 20. A fair test of that decision must therefore rebuild the world as it stood on day 20, not as it looks today. Four routes let the future in.
1. Revised data. The figure you hold today for day 20 may not be the figure that was published on day 20, because sources correct themselves. Reading the corrected series uses a number nobody had at the time. The cure is data that records when each value became known (Point-in-Time, Bitemporal Data).
2. A universe chosen with hindsight. If the test starts from “the items listed today”, it silently leaves out everything that was delisted, failed or merged along the way (Survivorship Bias). The honest universe on day 20 is whatever existed on day 20, including the items that later disappeared.
3. Labels that overlap the test. A label such as “growth over the next five days” uses five days of the future. A training example whose label window runs into the test period passes the answer into training (Purging and Embargo).
4. Calculations that look ahead. A centred moving average, a z-score computed with the mean of the whole series, a threshold tuned on the full history, a scaling fitted before the data were split: each lets later values influence earlier decisions (Moving Average, Data Leakage).
A worked example: choosing with hindsight
Take 1,000 items whose weekly counts change purely by chance: there is no pattern to find. Two analysts study them over 12 weeks.
The first asks: “Which 50 items grew most over the whole period, and what did they do early on?” The second asks: “Which 50 items grew most in weeks 1 to 6, and what did they do in weeks 7 to 12?” The experiment was repeated 300 times with new random data, and the results averaged.
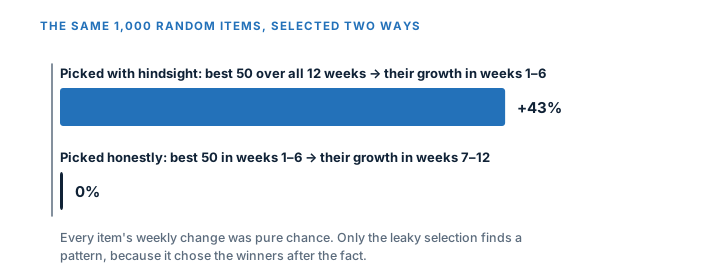
The first analyst reports that the winners were already growing fast in weeks 1 to 6: +43% on average. It sounds like an early-warning signal. But the items were chosen because they won, and winning includes the early weeks, so of course their early weeks look good. The second analyst, who chooses with only what was known at the time, finds nothing: 0% growth afterwards, which is the truth about these random items.
The first analysis is not a prediction. It is a description of the winners, written after the race.
Why it is so hard to see
Leaks rarely look like leaks. They hide in a database view that always shows the latest value, in a spreadsheet column added afterwards, in a “current” list of categories, in a feature calculated in a notebook cell that was run on the whole table. The visible symptom is a good-looking number, and nobody investigates good news.
Two signs should make you suspicious. The result is much better than comparable work. Or it does not survive the first weeks of real use.
| Input | Looks fine, but | The honest version |
|---|---|---|
| A price series | It is the corrected series, with revisions applied | The series as it was published on each date |
| A list of items | It is today’s list | The list as it stood on each date, including later exits |
| A label | It looks five days ahead | Purge training examples whose label window overlaps the test |
| A normalisation | The mean comes from the whole history | Mean and spread from data up to the decision date |
How to close the leaks
- Ask the date question of every input. For each field: when was this value known, and could the system have read it at the decision time?
- Freeze snapshots. Keep dated copies of source data and read “as of” the decision date, not “latest”.
- Build the universe forward. Start each test period from the list that existed then, including items that later disappeared.
- Split by time and purge. Train on the past, test on the future, and drop training examples whose labels reach into the test period (Walk-forward Validation).
- Compute features on a trailing window. Use only values up to the decision date (Feature Engineering).
- Keep a holdout untouched until the very end (Holdout Set), and count how many versions you tried (Backtesting, Multiple Comparisons Problem).
A final check
Take the best result of your analysis and write down, for each input, the date on which it became available. If any of those dates is later than the decision date, the result belongs in a different category. It is not “what would have worked”. It is “what the winners looked like afterwards”, which is interesting, but cannot be traded, acted on or promised to anyone.
References
- David H. Bailey, Jonathan M. Borwein, Marcos López de Prado, Qiji Jim Zhu. Pseudo-Mathematics and Financial Charlatanism: The Effects of Backtest Overfitting on Out-of-Sample Performance . Notices of the American Mathematical Society, 2014. DOI: 10.1090/noti1105
- Marcos López de Prado. Advances in Financial Machine Learning . Wiley, 2018. ISBN 978-1119482086.
- Martin Fowler. Bitemporal History . martinfowler.com, 2021.